map=yes
is a collaboration between MapQuest Open and Stamen Design, using data from the OpenStreetMap project. The project is an exploration of new frontiers in online cartography and the mapping of open data.
More and more open data is coming online every day. Companies like MapQuest are building businesses in this new ecosystem, where curation of data and the accessibility and always-on nature of the internet enable new kinds of interaction, visualization and mapping.
All the code used to generate these maps is available for download and liberal re-use.
Most online maps are are designed to help you get around in a car. This generally means displaying: roads, businesses, buildings, on-ramps, parks, oceans and traffic congestion. Nothing wrong with that! Designers get handed a tool kit that has as many tools as a good swiss army knife, and the maps reflect these tools. Millions of people use them to make appointments across town, find restaurants, and drive home for the holidays.
But what if, instead of a swiss army knife, we used a box of crayons? Or charcoal and newsprint? Or play-doh? What would those maps look like? What could they tell us about the world?
Working with MapQuest, we've put together a new set of interactive maps using OpenStreetMap data that explore this question. It's called "map=yes", and it has three objectives:
OpenStreetMap is made of the contributions of volunteers all around the world, who add features to the map in much the way that you'd create a new entry in Wikipedia. This analogy holds true at multiple levels. This is a community that's dedicated to doing the hard work of making a map of the whole world that's free for everyone to use, and it has the same kinds of dedicated volunteers, large numbers of casual participants, and long-running arguments between them on the finer points of how sidewalks should be referenced that you'd expect from a community of volunteers.
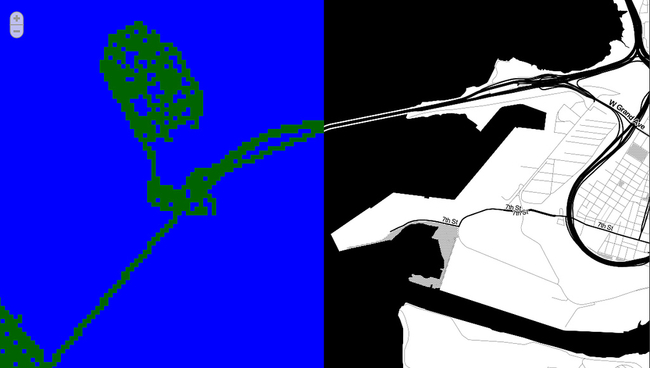
All of this means that, just like Wikipedia, OSM coverage of the world is not entirely even. Some cities, like Berlin and Paris, have been mapped so extensively that it seems clear that some civic body has been bulk-uploading buildings. Other places, like Beijing, are pretty spotty, with mostly famous buildings mapped. Others, like Minneapolis, have been partially filled in, with some areas completely filled in with buildings and some completely empty, often side-by-side. But by and large, objects that are buildings are tagged with data that looks like "building=yes", and parks are tagged with "leisure=yes".
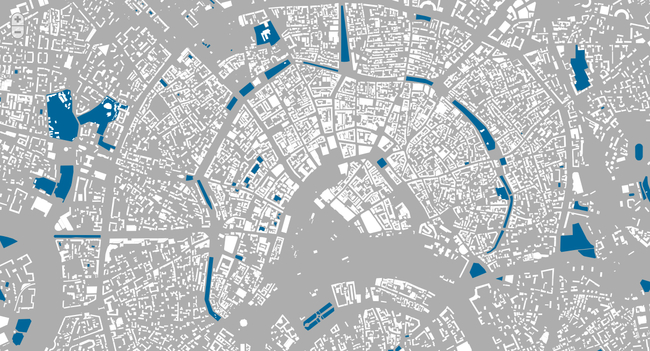
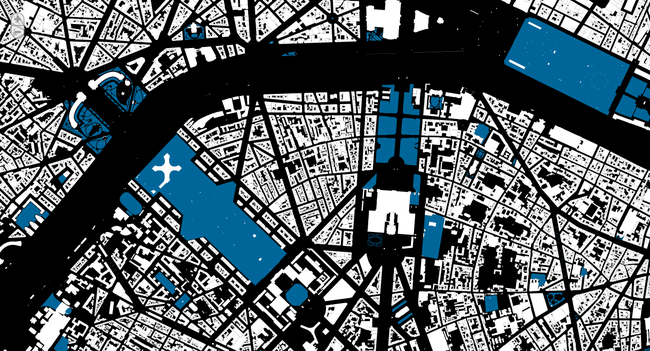
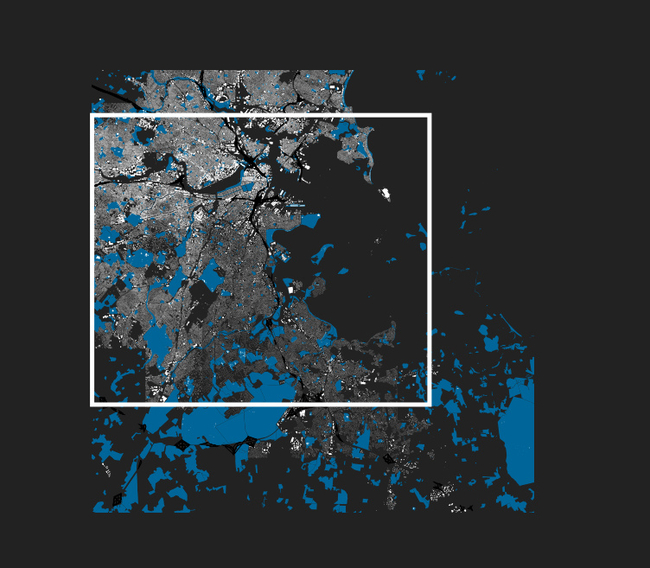
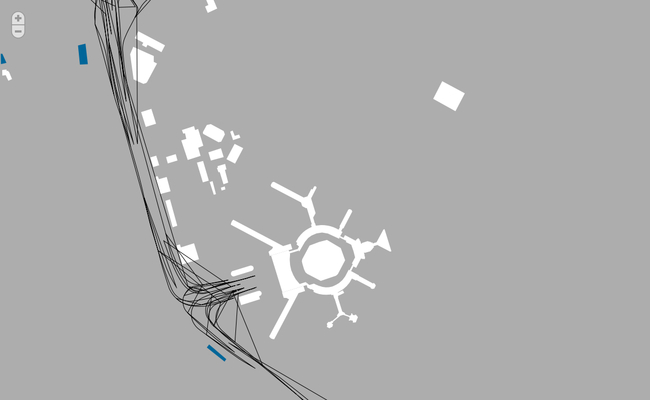
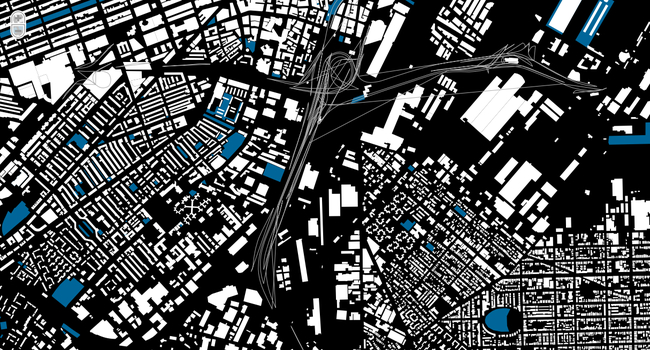
These maps take a slice through a city and draw *only* those items where "building=yes" (white shapes), "leisure=yes" (blue shapes), and "onramp="yes" (black lines). The background colors are a matter of preference: all-black, grey-to-black as you zoom in, or black-to-grey.
We've chosen a series of cities that we think are representative of the wide range of coverage that's available in Open Street Map, and also for their expressive potential. New York reveals a cluster of interest in downtown Manhattan and Roosevelt Island, without much else of distinction except the freeways. Paris sprawls densely along the Seine with enormous parks to the east and west of the city center. Toronto hugs Lake Ontario with parks like veins threading back away from the shoreline. Cities have character, and this is reflected in more than just their streetscapes or their skylines—it's reflected in how they're mapped by volunteers.
We're delighted that MapQuest is willing to take on the risk and burden of maintaining the XAPI infrastructure and seeing what shakes out. Maintaining mapping infrastructure for the whole world that developers can rely on is still non-trivial, and it's not entirely clear to everyone yet what the business case for maintaining access to this kind of data is.
Unless.
We're seeing a general shift in the world away from a model where physical inclusion in a collection matters as to whether something has value or not. Museums, for example, used to be basically the only ones that could say whether a painting was really worth looking at, because they only had so much room on their walls, and so had to make choices as to what they could hang.
This is increasingly less and less the case as the Internet makes visual culture available to anyone with a laptop or iPhone. At the same time, Amazon is making the limitations of the physical space of a bookstore irrelevant, because they just have everything. And software is increasingly moving away from the limitations of a desktop model, where you periodically get DVDs in the mail, to an online, always-connected model where data moves from one machine or service to another easily.
What this means is that it's becoming less and less practical for museums, bookstores or software companies to compete on the idea of scarcity: locking people into their particular exhibition schedule or physical location or version 10.whatever. To stay relevant they'll need to compete instead on features: making sure the curation is good in the museum show, providing an inviting environment to browse books in, and making sure that people can get at the information they want without feeling like they have to sign away their rights to use their own stuff. And if people are given the choice between the old way and the new way of participating in culture, and the new version is easier? They'll flock there in droves.
By promising to keep the OSM XAPI up and running, which gives normal people access to Open Street Map data, MapQuest is taking a bet on the future of mapping. By making it available to developers and continuing to improve it over time, it gives us the opportunity to make maps that we can't even imagine yet. The format has it's limitations, to be sure: it's still not as easy as Wikipedia, and it takes a commitment to participate in the project. But if there used to be a 1000-foot-high wall between the public and OSM data, there's now a 100-foot wall. And that sets a trajectory that points pretty clearly towards lower and lower walls, and that's where the pressure comes from. This is just the beginning!
We've written a tutorial that will show you how to make your [map=yes] tiles. Enjoy! And please let us know what you think.