map=yes
is a collaboration between MapQuest Open and Stamen Design, using data from the OpenStreetMap project. The project is an exploration of new frontiers in online cartography and the mapping of open data.
More and more open data is coming online every day. Companies like MapQuest are explore ways of building businesses in this new ecosystem, where curation of data and the accessibility and always-on nature of the internet enable new kinds of interaction, visualization and mapping.
All the code used to generate these maps is available for download and liberal re-use.
This is a short tutorial designed to show you how to make your own [map=yes] style map tiles.
The first thing we need to do is start by explaining some of the basic building blocks of OpenStreetMap (OSM): nodes, ways and tags and how you can query them using MapQuest's XAPI service. If you're already familiar with these things you can skip straight to the part where we make tiles.
nodes are points
on the Earth. Each node has a unique ID and latitude and longitude associated with it:
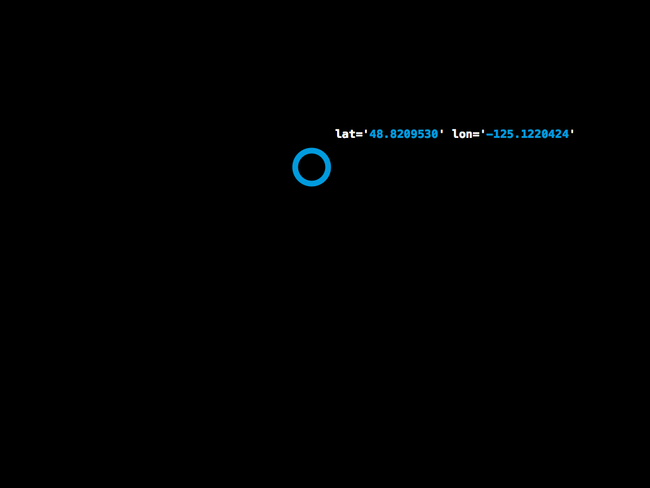
As you can see, they are an exciting bunch.
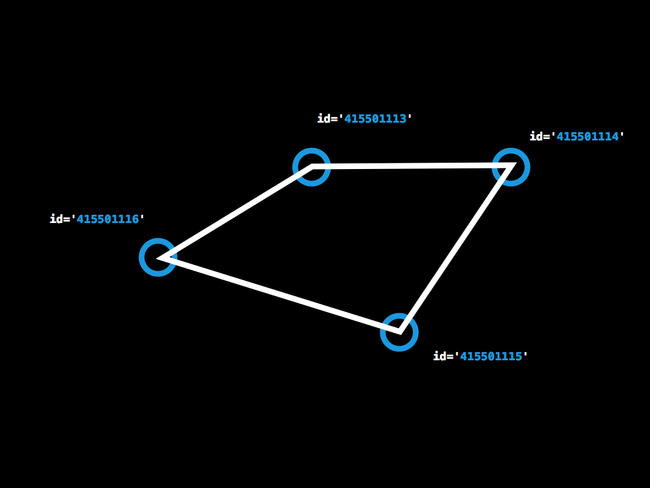
ways are collections of nodes that form an atomic thing
in the world, say a building or a bridge or a highway. Every way is also assigned a unique ID.
Both nodes and ways have zero or more tags associated with them. A tag has a key (which can be thought of as a domain or namespace) and a value:
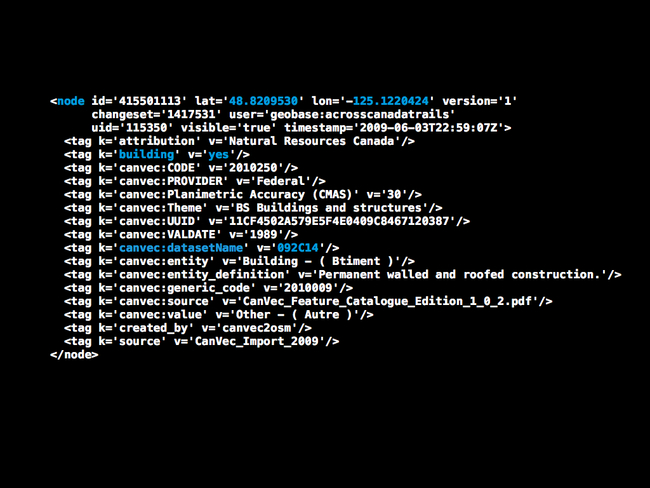
There is no limit on the number of tags a node or way can have. The OSM site has this to say about tags:
OpenStreetMap does not have any content restrictions on tags that can be assigned to OSM-Elements (Nodes Node, Ways Way or Relations Relation). You can use any tags you like as long as the values are verifiable. However, there is a benefit in agreeing to a recommended set of features and corresponding tags in order to create, interpret and display a common basemap. This page contains a core recommended feature set and corresponding tags.
If you don't see an appropriate tag for what you would like to map see Proposed features or for grouping ways and nodes together into a higher level component, see Relations. From there you can see what features may be added (and maybe get them in sooner), or propose your own.
Not every tag added to the database is displayed on the OSM map. In fact, there are actually two databases used by the OSM community. The first is a rendering
database and is a trimmed down verion of all the data stored in OSM for the purpose of creating the map you see at openstreetmap.org. The second is a tagging
database and used to do general tag queries or even to create new rendering databases for bespoke maps.
This is where MapQuest XAPI API service comes in. XAPI stands for extended API
and it is a way for users to query the tagging
database over HTTP.
For example, here's how you retrieve nodes tagged as pubs in central Washington DC:
# If you're thinking about clicking the link below just be ready for
# the fact that it returns information that's been formatted for robots;
# this is the raw data that OSM exports. Also, the bounding box in the
# URL below has been truncated because it is very long (the URL is still
# correct though).

# The actual bounding box is: -77.041,38.885,-77.007,38.900
GET http://open.mapquestapi.com/xapi/api/0.6/node[amenity=pub][bbox=...]
That URL can be understood as: Where the XAPI service lives online + search nodes or ways (nodes in this case) + a tag filter (nodes whose amenity tags have a value of "pub") + a bounding box (only nodes contained by this area).
Here's a simplified diagram of how the two databases, described above, and XAPI fit together:
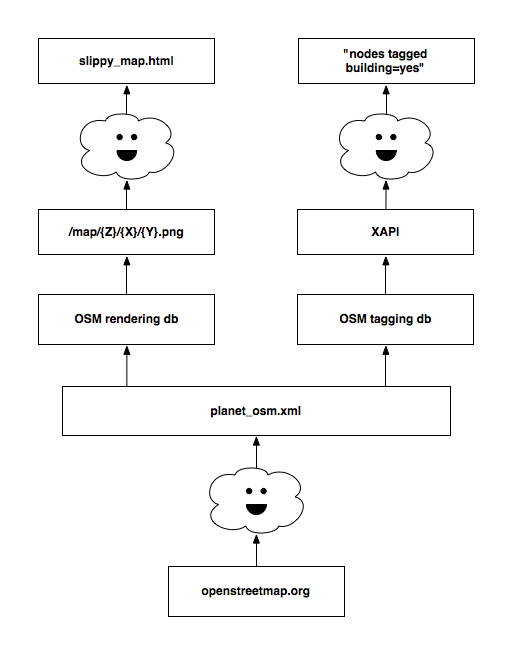
The planet_osm.xml
file, above, is the export of all the data in OSM and feeds both the tagging and rendering database. The last time I checked it was 17GB compressed!
The XAPI service is what we've used to create all the tiles for [map=yes]. We wrote a pair of tile providers
(the code that takes a request for a map tile and actually fetches the data and creates the tile image displayed in your browser) that allow you to create your own maps of any set of nodes or ways that match a tag query. What kinds of tags? Well, any of them! That's where the magic starts to happen.
The OSM map features page is a good place to look for tags that are in OSM. Another good source for inspiration are the OSM Projects of the Week where users are encouraged to go out in their communities to map and tag specific features in OSM like museums or florists or even public toilets.
How awesome is that?
Let's say you wanted to generate Frank Miller
style tiles for all the buildings in your city. Like this:
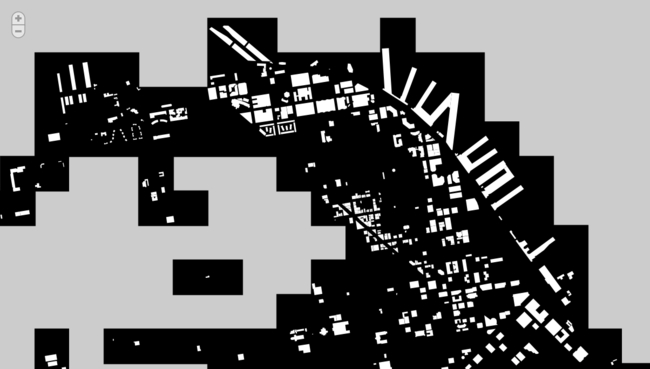
These are actually two separate tilesets, layered on top of one another: boolean (black) and footprint (white) on a grey background.
The black squares are called boolean tiles because instead of drawing the actual data that comes out of OSM (say, the outlines of buildings) they depict the presence of that information in the tile instead.
In these examples, we've created a tile provider that sub-divides a standard 256 pixel by 256 pixel map tile in to an 8 by 8 grid and then, for each one of those cells, asks the MapQuest XAPI service whether there are any ways in OSM tagged with a building key. If the answer is yes
then the cell is filled with black. If not it is left transparent.
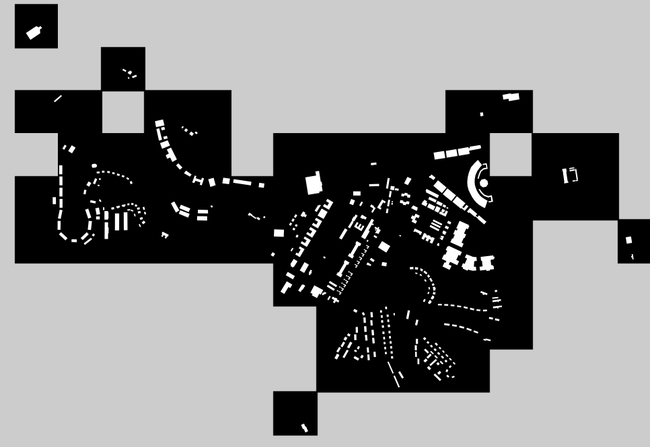
The white buildings are called footprint tiles because they draw the contours of ways matching a tag query filled with a solid colour on top of a transparent background. (You can also use the footprint provider to draw open-ended lines but we'll get to that a little later.)
In order to get started you will need to install TileStache, a set of Python-based tools for producing and serving map tiles. Once you've done that you'll need to create a TileStache config file.
Config files are defined using the JSON format and have both a cache and a layers section. The first defines some details about how and where to store the finished tiles. The second contains an entry for each distinct set of tiles that you want TileStache to create. Here's a simple example where we will create a cached version of every tile in a folder called tiles:
{
	"cache": {
        	"path": "tiles",
		"dirs": "safe",
		"name": "Disk"
	},

	"layers" : {
Here's how we would define a layer for boolean tiles:
	"building_boolean" : {
		"provider": {
			"class" : "mapequalsyes.boolean.Provider",
			"kwargs" : {
				"type" : "way",
				"query" : "[building=*]",
				"zoom_factor" : 3,
				"fill" : "#000000",
			}
		},
		"projection": "spherical mercator"
	},
Let's take a moment to look at some of the details.
The layer itself is called building_boolean and it is going to look for instructions on how to create new tiles from a provider
. TileStache has many kinds of provider but in this case it's going to look for a Python library called mapequalsyes.boolean.Provider.
In practical terms that means TileStache is going to look for a folder called mapequalsyes that contains a file called boolean.py that contains a piece of code called Provider. Which means: If the code that you can download below lives in the same folder as your TileStache config file you should be all good.
Next up is the kwargs dictionary which contains details that will tell the mapequalsyes.boolean.Provider code what to do:
type: whether to query for OSM nodes or ways.query: the key, value tag pair to query OSM with. A value of *means any value for the key you've defined.
zoom_factor: this is the power of two that will be used to sub-divide each tile. For example, two to the power of 3 is 8 which will result in a grid with 64 cells.fill: a hexidecimal (web) colour that matching cells will be filled in with (in this case black).As of this writing the query parser used by the mapequalsyes only supports a subset of the full XAPI query syntax. Currently only key=value or key=* queries are accepted.
Okay!
Now add a provider for your footprint tiles. It looks almost exactly like the first provider:
	"building_footprint" : {
		"provider": {
			"class" : "mapequalsyes.footprint.Provider",
			"kwargs" : {
				"type" : "way",
				"query" : "[building=*]",
				"fill" : "#FFFFFF",
			}
		},
		"projection": "spherical mercator"
	}
The only differences are the provider's Python class which contain the instructions for rendering the tiles (as outlines instead of a series of grid cells) and the absence of a zoom_factor attribute because it is not necessary.
To see those tiles in action you will need to run TileStache as a tile server
. You should consult the Serving Tiles section of the TileStache documentation for more details on setting up a real-live production tile server but the simplest way to get started is to run the tilestache-server.py program.
It is included with TileStache and is started from the command line:
$> tilestache-server.py -c tilestache.cfg
This will start a little web server on your local machine which you can make requests of by visiting: http://localhost:8080. To see your building_boolean tiles you would go to: http://localhost:8080/building_boolean/preview.html.
You can also use the tilestache-seed.py program to pre-render the tiles. To pre-render tiles for the city of San Francisco for zoom levels 12 through 14 you would do this this:
$> tilestache-seed.py -c tilestache.cfg -e png -l building_footprint \
   -b 37.703 -122.515 37.854 -122.324 12 13 14

$> tilestache-seed.py -c tilestache.cfg -e png -l building_boolean \
   -b 37.703 -122.515 37.854 -122.324 12 13 14
Not all ways in OSM are polygons so if you need to render things that should be drawn as lines, instead, your layer config should contain a filltype argument whose value is line
:
	"motorway_links_footprint" : {
		"provider": {
			"class" : "mapequalsyes.footprint.Provider",
			"kwargs" : {
				"type" : "way",
				"query" : "[highway=motorway_link]",
				"fill" : "#ADADAD",
				"filltype" : "line",
			}
		},
            	"projection": "spherical mercator"
		}
	}
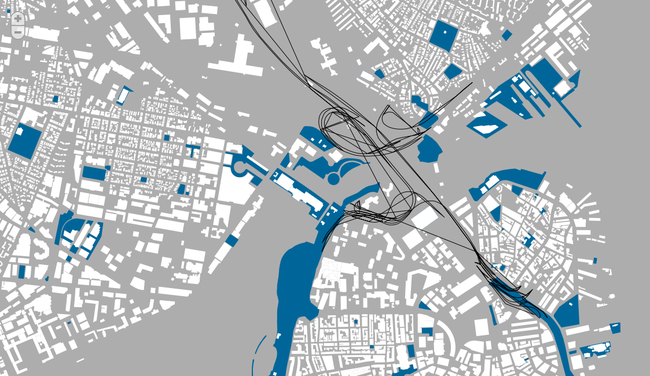
Here's an example of a map with three footprint layers (buildings; leisure areas; on/off ramps) where one of them is drawn with a line
filltype:
Now that you've got map tiles how do you show them? There are a number of JavaScript mapping libraries you can use your new map tiles with including:
Each one of those libraries has documentation to help to you get going but here's a example web page that uses Polymaps to display a full screen map of footprint tiles for buildings:
<html>
  <head>
    <title>Building Footprint Map</title>
    <script type="text/javascript" src="polymaps.min.js"></script>
    <script type="text/javascript">

function helloworld(){

// first we create an SVG element and add
// it to the document "body".

var svg = org.polymaps.svg("svg");
var parent = document.body.appendChild(svg);

// Next, we create the "map" and add to the
// SVG element.

var map = org.polymaps.map();
map.container(parent);

// Now we'll create a tile "layer" and add it to the map. Specifically an
// "image" layer (we'll get to other kinds of layers later) that conforms
// to the TMS standard for slippy map tiles. When Polymaps needs to fetch
// a tile it will work out how to replace {Z} with the current zoom level
// and {X} and {Y} with the correct column and row accordingly.

// Hey look! The tiles you defined above!!

var tiles = org.polymaps.image();
tiles.url('http://example.com/tilestache.cgi/building_footprint/{Z}/{X}/{Y}.png');

map.add(tiles);

// Add some "controls" to the map; these are things
// like the ability to pan the map and zoom in or out
// by double-clicking on the map. The "interact" method
// is just a wrapper around a bunch of common controls.

var controls = org.polymaps.interact();
map.add(controls);

// Set the zoom range for the map. This means you won't be
// able to zoom in closer than zoom level 17 (street level)
// or further than zoom level 2 (basically, continents)

map.zoomRange([10, 15]);

// Now, tell the map where to go.

map.center({lat: 37.404500, lon: -121.975202});
map.zoom(12);

// That's it!
}
</script>

    <style type="text/css">

/* use these styles to make sure that the map fills the entire
   browser window */

body { margin: 0; }
svg { height: 100%; width: 100%; }

</style>
    </head>
  <body onload="helloworld();">
    <!-- See this? There's nothing here! The map is going to fill
         the entire browser window. -->
    </body>
</html>
The mapequalsyes Python libraries described above are available for download at: mapequalsyes-tilestache.tar.gz. (The also a plain-old zipped version if you prefer.) The source code is open source but here's the license in full if you're curious:
Copyright (c) 2011 Stamen Design

Permission is hereby granted, free of charge, to any person
obtaining a copy of this software and associated documentation
files (the "Software"), to deal in the Software without
restriction, including without limitation the rights to use,
copy, modify, merge, publish, distribute, sublicense, and/or sell
copies of the Software, and to permit persons to whom the
Software is furnished to do so, subject to the following
conditions:

The above copyright notice and this permission notice shall be
included in all copies or substantial portions of the Software.

THE SOFTWARE IS PROVIDED "AS IS", WITHOUT WARRANTY OF ANY KIND,
EXPRESS OR IMPLIED, INCLUDING BUT NOT LIMITED TO THE WARRANTIES
OF MERCHANTABILITY, FITNESS FOR A PARTICULAR PURPOSE AND
NONINFRINGEMENT. IN NO EVENT SHALL THE AUTHORS OR COPYRIGHT
HOLDERS BE LIABLE FOR ANY CLAIM, DAMAGES OR OTHER LIABILITY,
WHETHER IN AN ACTION OF CONTRACT, TORT OR OTHERWISE, ARISING
FROM, OUT OF OR IN CONNECTION WITH THE SOFTWARE OR THE USE OR
OTHER DEALINGS IN THE SOFTWARE.
Go make some awesome maps!